
The Migrations dashboard allows Jira administrators to track and monitor data migrations from your previous Jira instance (Jira Data Center) to your current Jira Cloud environment.
This page provides visibility into all migration activities, their current status, and any issues that may have occurred during the migration process.
🚀 Accessing the Migrations Page
Jira administrators can access the tracking history by following these steps:
-
Click the cogwheel icon ⚙️ (Settings) located at the top right corner of your Jira instance.
-
Select Marketplace apps.
-
In the left sidebar menu, look for the Shared Estimations section and click on Migrations.
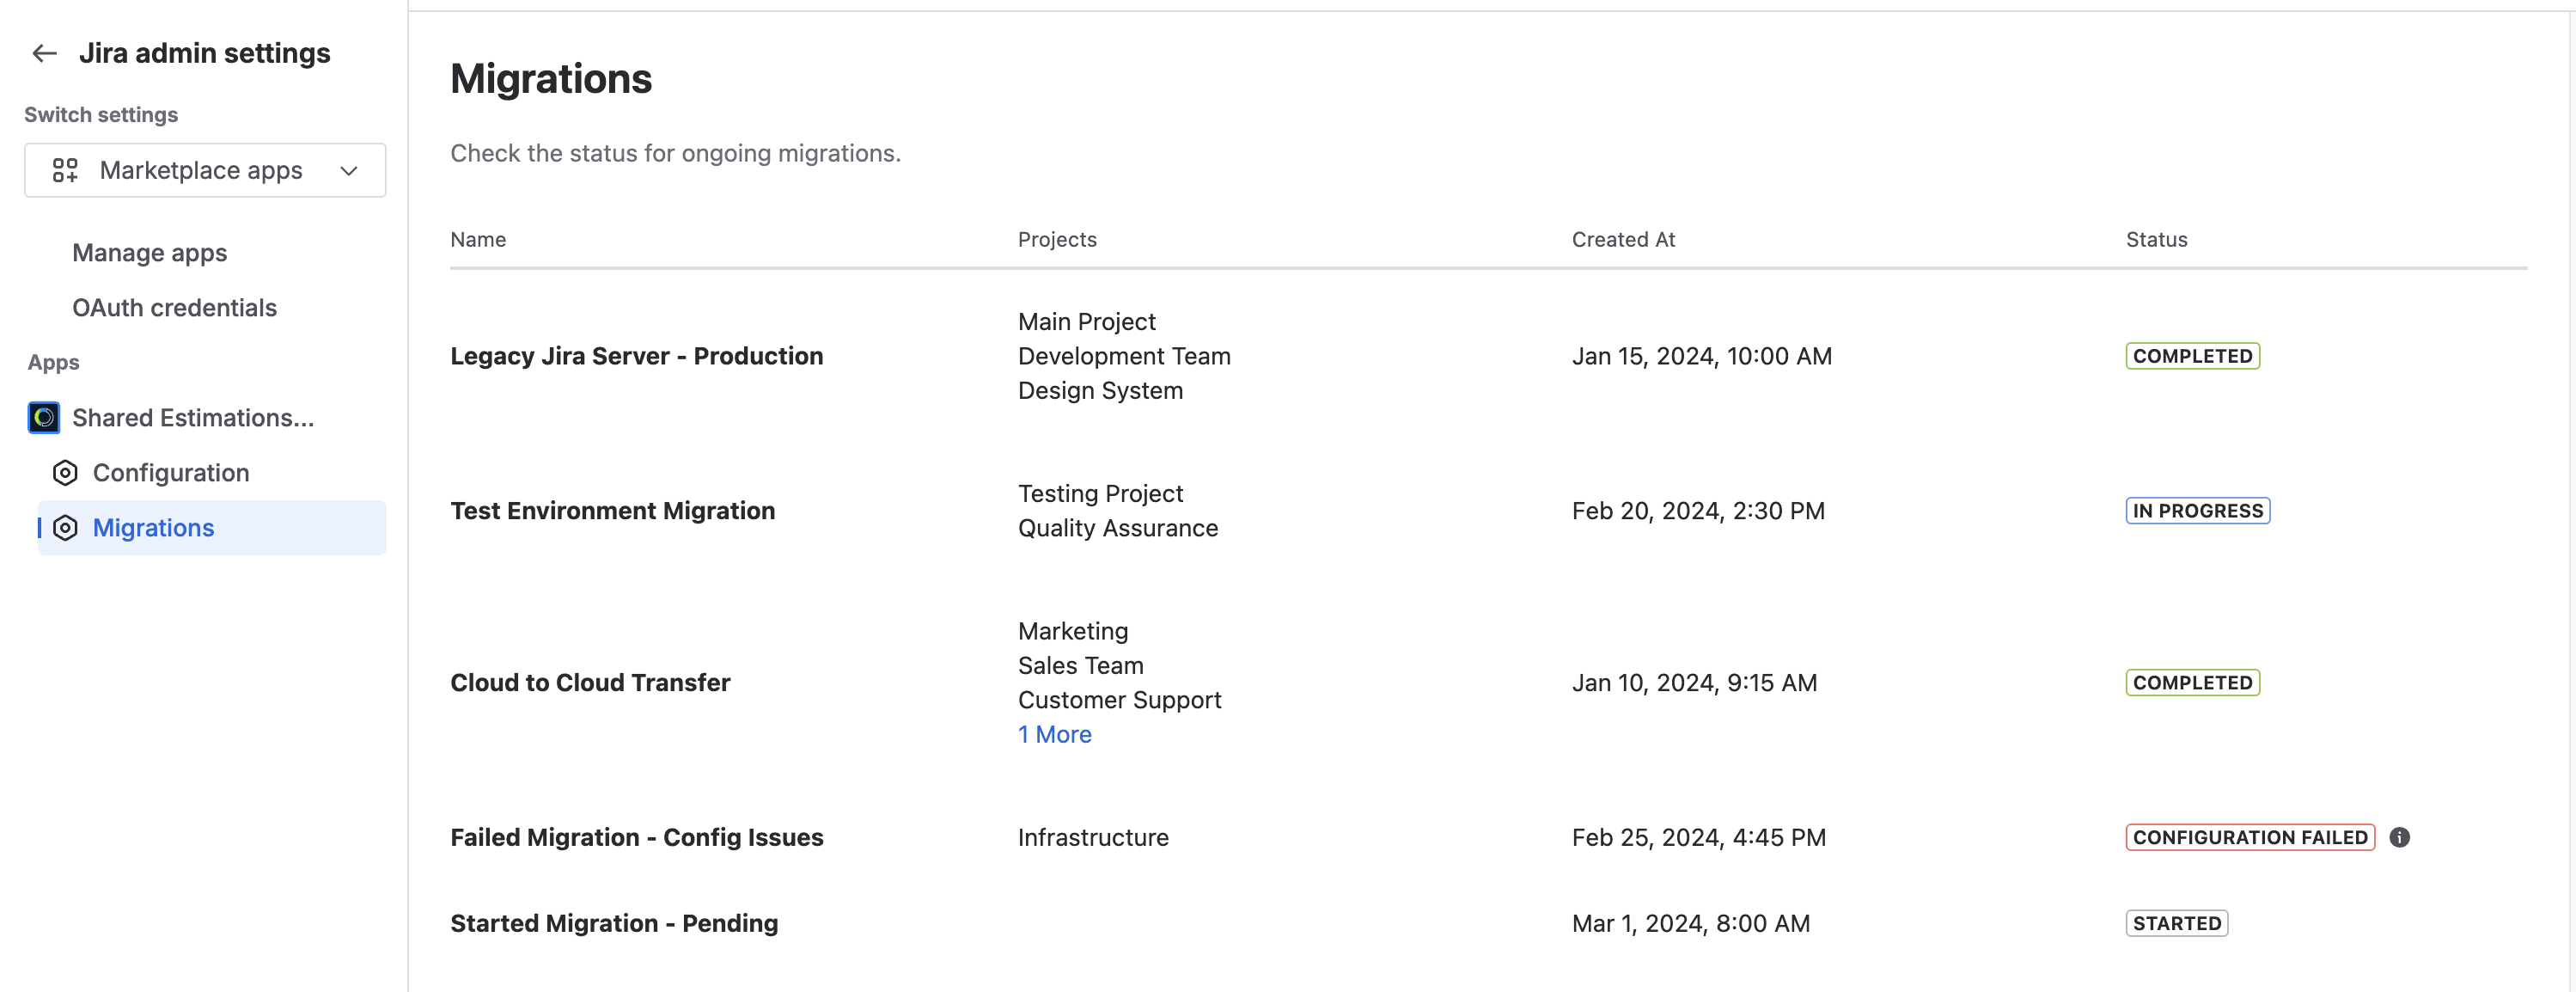
📊 Understanding the Migrations Table
-
Name: The name of the originating instance or server where the data is coming from (e.g., Legacy Jira Server - Production).
-
Projects: A list of the specific Jira projects whose estimation data was included in this transfer.
-
Created At: The exact date and timestamp showing when the migration process was initiated.
-
Status: Reflects the current state of the migration. It will display one of the following badges:
-
🆕 Started: The migration request has been received and initialized.
-
🔄 In Progress: Data is actively being transferred and processed.
-
✅ Completed: The data has been successfully imported into Shared Estimations.
-
❌ Configuration failed / Estimation failed / Failed: An error occurred, and the migration was aborted. The badge text automatically updates to show which part of the process caused the failure. Hovering over any of these failed badges reveals a tooltip with the detailed error message.
-
To help you easily search and analyze your migration history, the table fully supports data sorting. You can click on the column header to toggle the sorting order of the displayed records. For example, clicking on the Created At column header allows you to switch the view to display the most recent migrations first. Clicking it again will reverse the order to show the oldest migrations at the top of the table.
🔧 How the Detailed Error Message Works
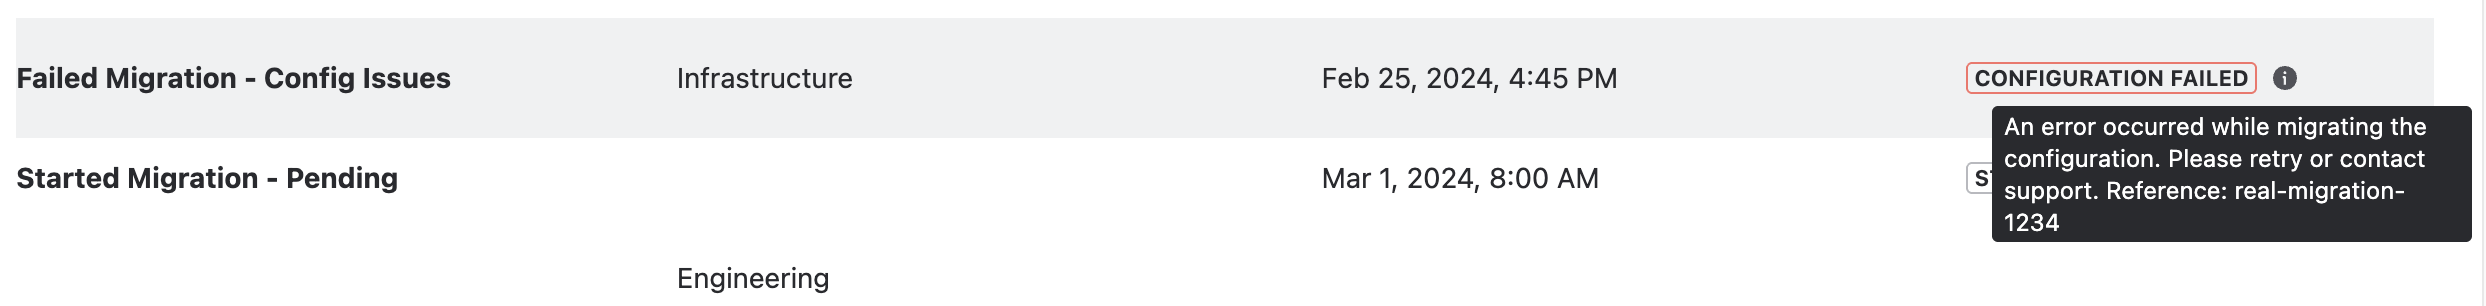
To keep the dashboard clean, detailed technical logs are kept hidden until needed. If a migration stops and displays a failure badge, simply hover your cursor over the badge to read the diagnostic tooltip.
The tooltip displays the exact context of the failure based on its category:
-
Configuration failed: Displays details about missing, empty, or incompatible configuration files from the source instance. (e.g., “An error occurred while migrating the configuration...”).
-
Estimation failed: Displays details regarding corrupted or unsupported vote history, story points, or estimation scales. (e.g., “An error occurred while migrating the estimations...”).
-
Generic failed: Indicates unexpected system errors, file processing issues, or timeouts during the transfer.
💡 Tip: Every failure tooltip includes a unique Reference ID (e.g., real-migration-1234). If you need to open a support ticket, please include this Reference ID so our team can immediately locate the exact technical details in the system logs.